Power BI Updates May 2024

With carefully designed reports, you can get complete insight into your business data with just a few visualizations.
The following updates will be summarized below:
Reporting
- Modern Tooltip now on by Default
- Matrix Layouts
- Line Updates
- On-Object Interaction Updates
- Publish to folders
- You can now ask Copilot questions about data in your model
Modeling
Reporting
Modern Tooltip now on by Default
Power BI tooltips are embarking on an evolution to enhance their functionality. To lay the groundwork, Microsoft is introducing the modern tooltip as the new default, a feature that many users may already recognize from its previous preview status. This change is more than just an upgrade; it’s the first step in a series of remarkable improvements. These future developments promise to revolutionize tooltip management and customization, offering possibilities that were previously only imaginable. As Microsoft prepares for the general availability of the modern tooltip, this is an excellent opportunity for users to become familiar with its features and capabilities.
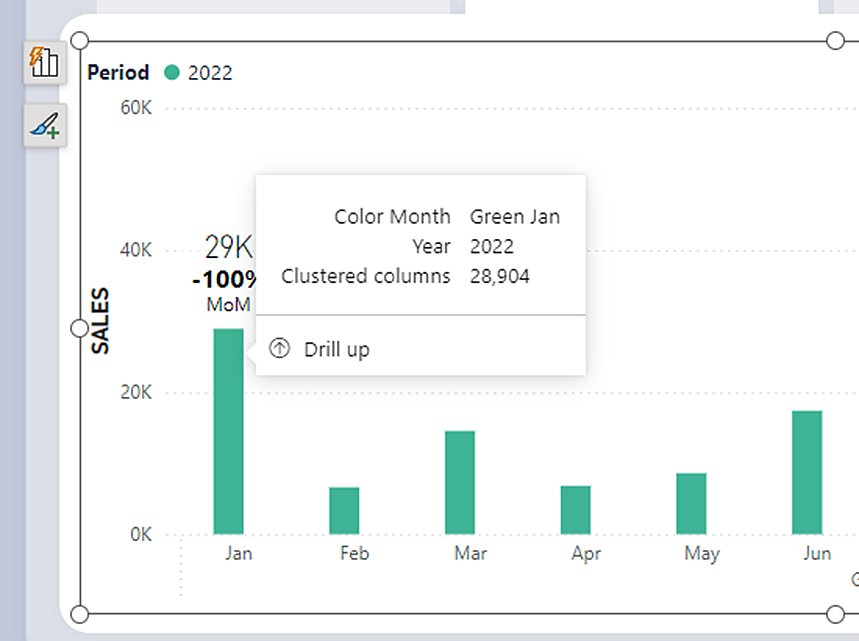
Discover the full potential of the new tooltip feature by visiting the dedicated blog. Dive into the details and explore the comprehensive vision they’ve crafted for tooltips, designed to enhance your Power BI experience.
Matrix Layouts
Microsoft listened to community’s feedback on improving the tabular visuals (Table and Matrix), and they’re excited to initiate their transformation. Drawing inspiration from the familiar PivotTable in Excel, they aim to build new features and capabilities upon a stronger foundation. In the May update, Microsoft is introducing ‘Layouts for Matrix.’ Now, you can select from compact, outline, or tabular layouts to alter the arrangement of components in a manner akin to Excel.
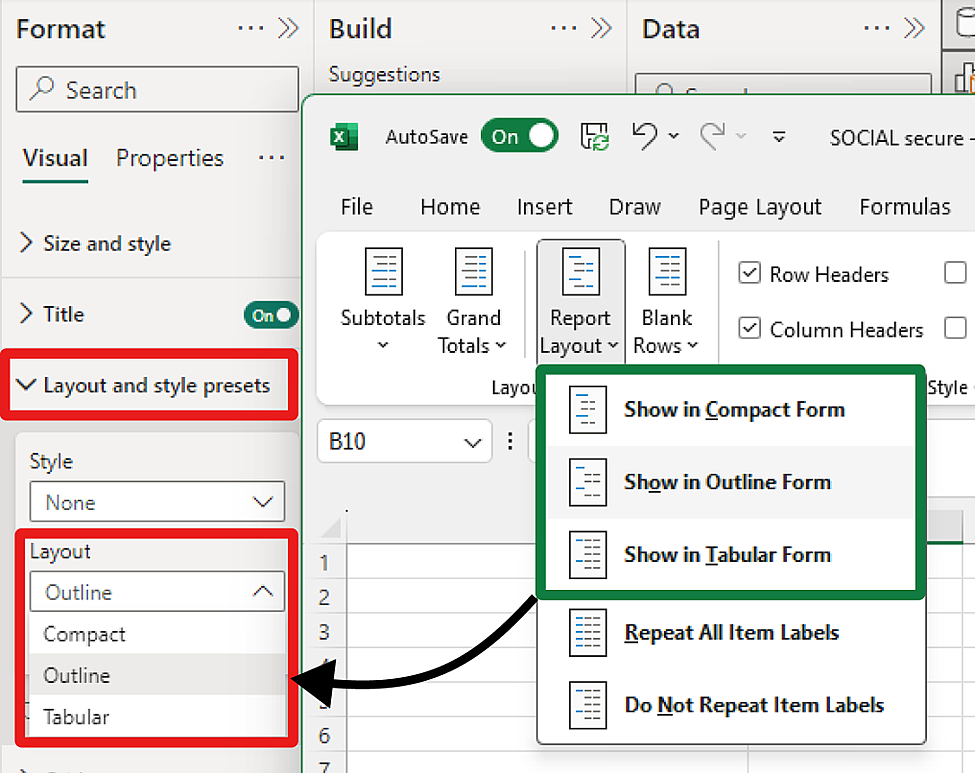
 Matrix visual showing the Outline layout with classic matrix structure.
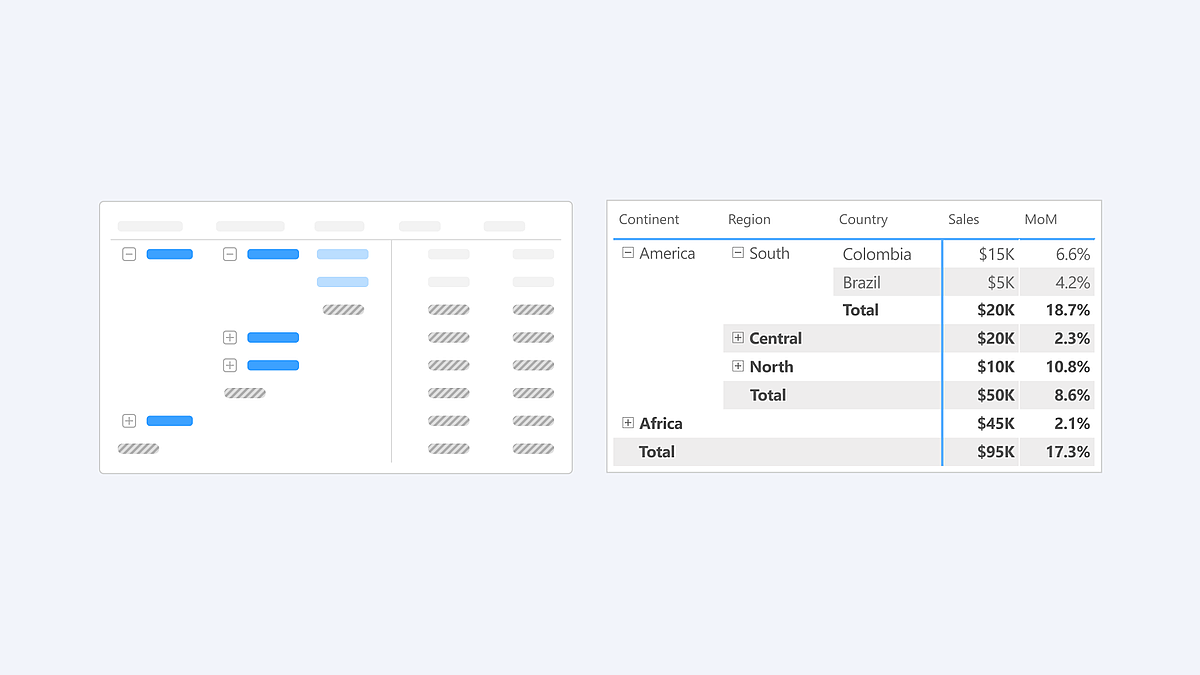 Matrix visual showing the Compact layout.
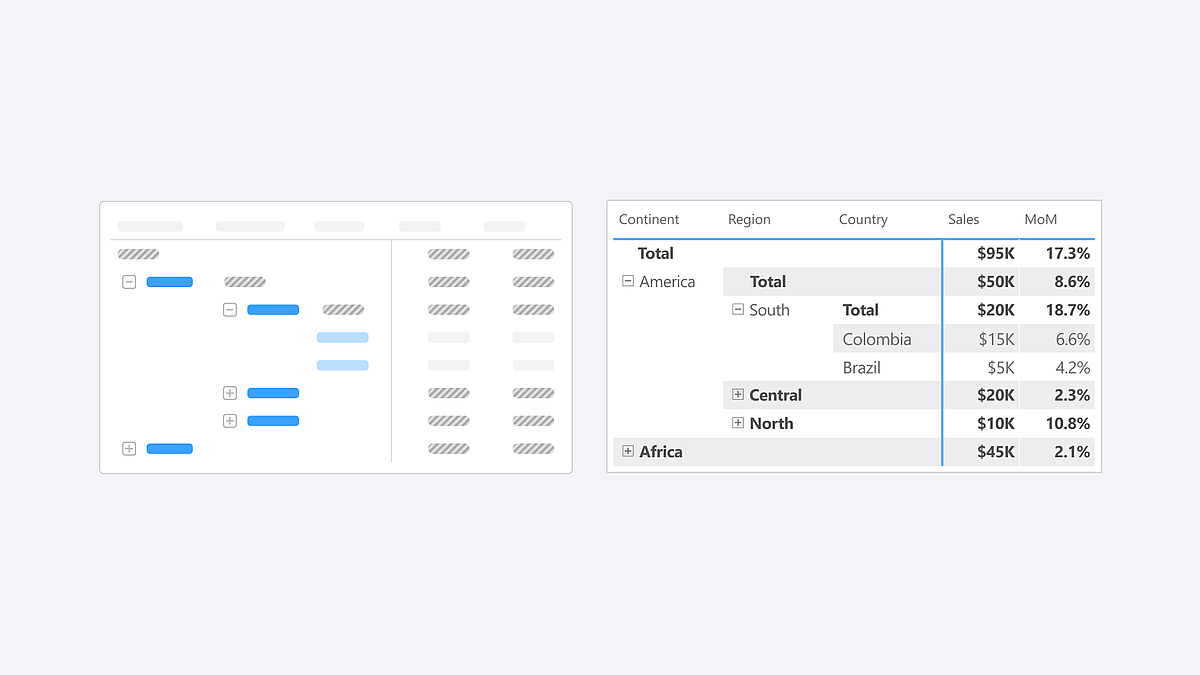
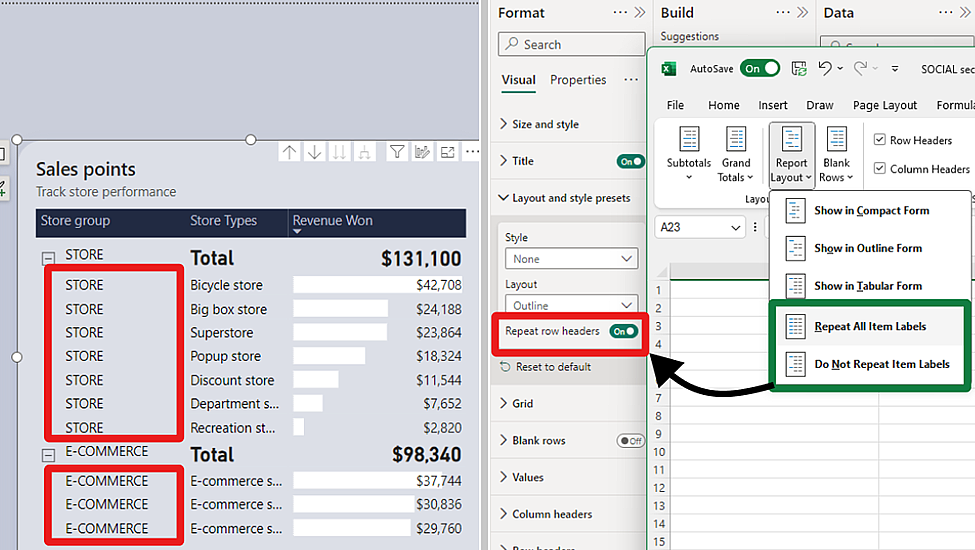
As an extension of the new layout options, report creators can now craft custom layout patterns by repeating row headers. This powerful control, inspired by Excel’s PivotTable layout, enables the creation of a matrix that closely resembles the look and feel of a table. This enhancement not only provides greater flexibility but also brings a touch of Excel’s intuitive design to Power BI’s matrix visuals. Only available for Outline and Tabular layouts.
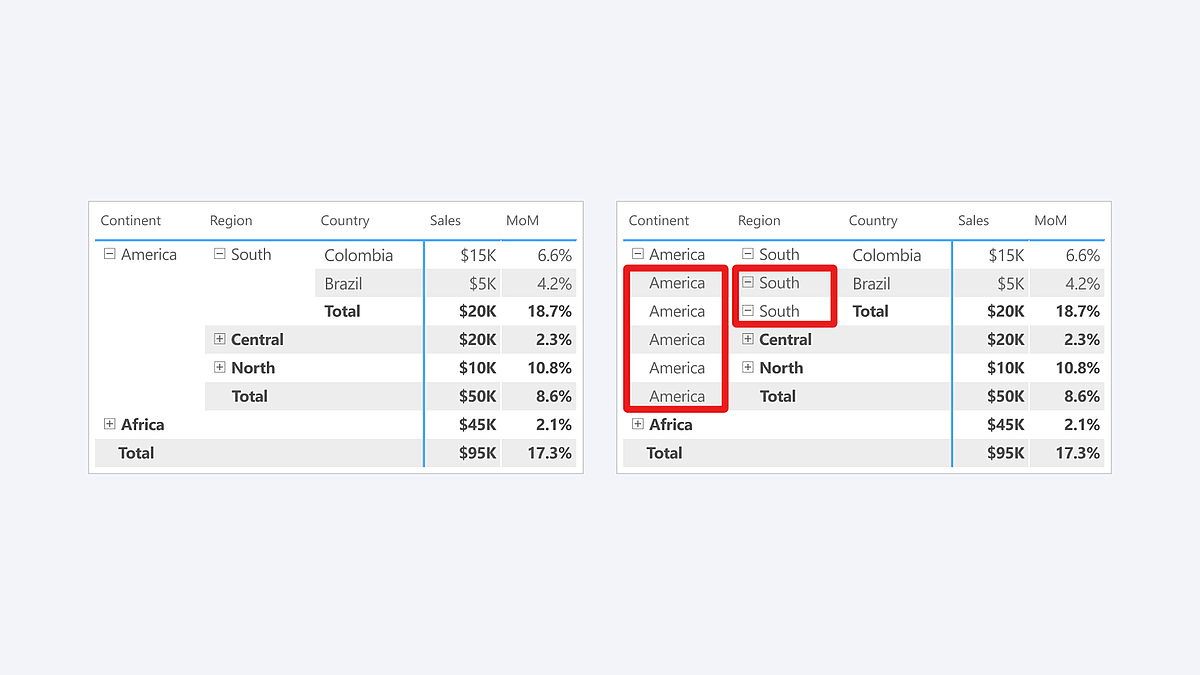 Matrix Visual showing the new Repeat Row Headers feature.
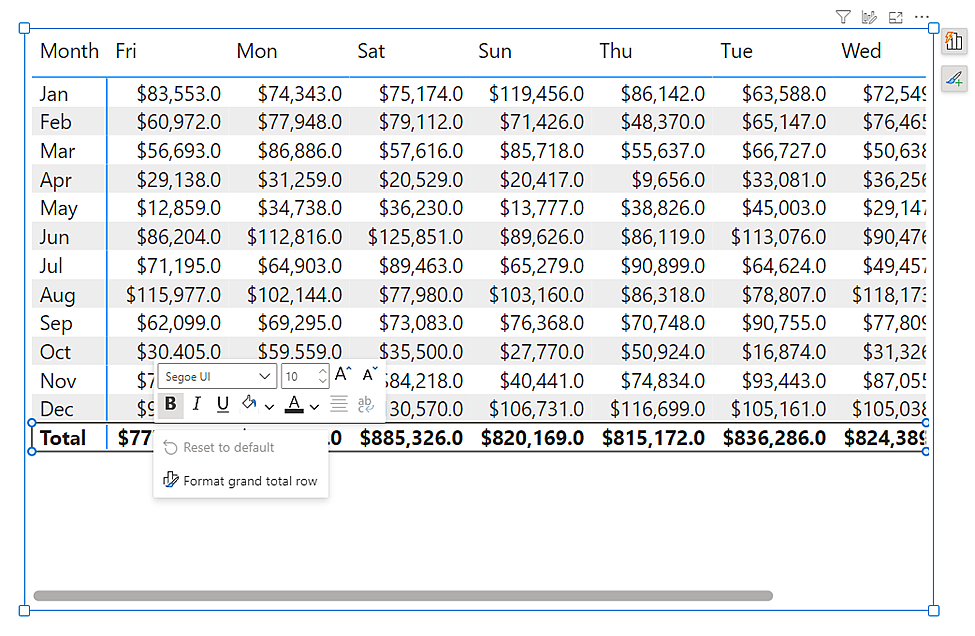
To further align with Excel’s functionality, report creators now have the option to insert blank rows within the matrix. This feature allows for the separation of higher-level row header categories, significantly enhancing the readability of the report. It’s a thoughtful addition that brings a new level of clarity and organization to Power BI’s matrix visuals and opens a path for future enhancements for totals/subtotals and rows/column headers.
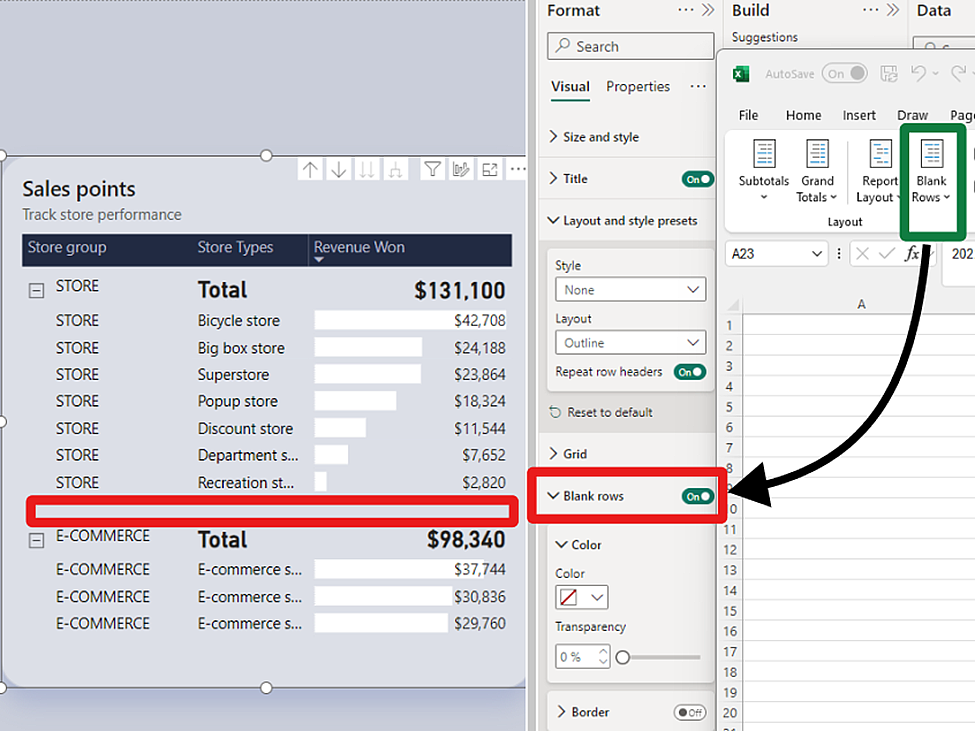
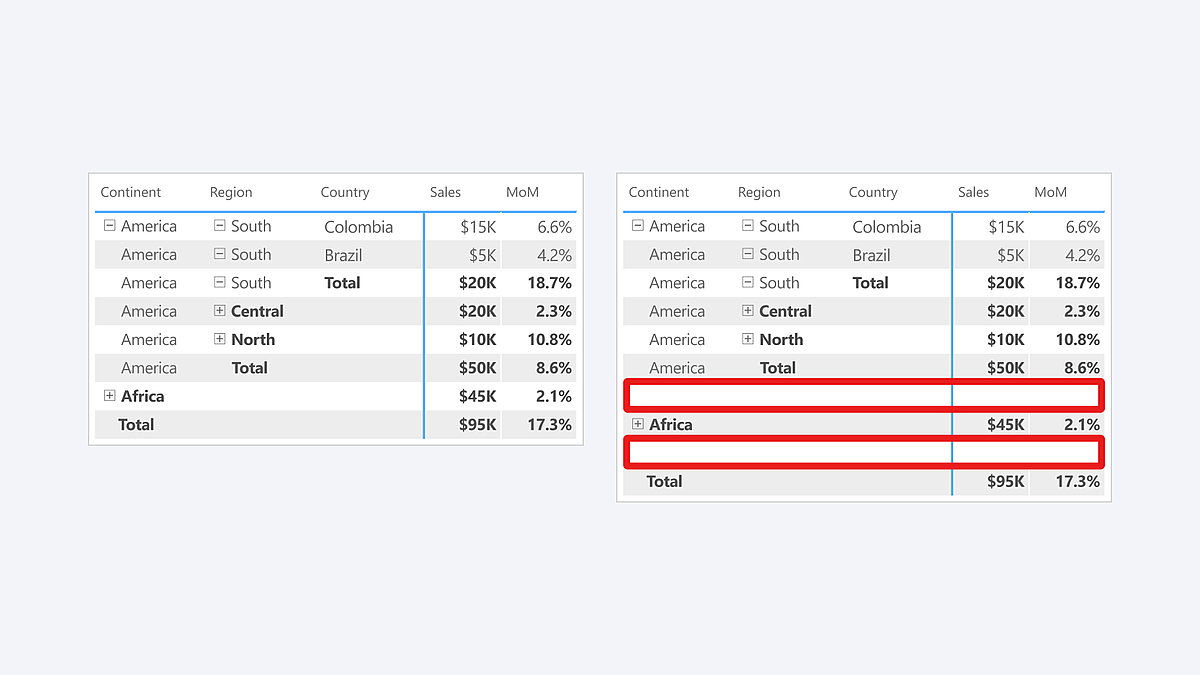
Matrix Visual showing the new Blank Rows feature.
We understand your eagerness to delve deeper into the matrix layouts and grasp how these enhancements fulfill the highly requested features by the community. Find out more and join the conversation in Microsoft’s dedicated blog, where they unravel the details and share the community-driven vision behind these improvements.
Line Updates
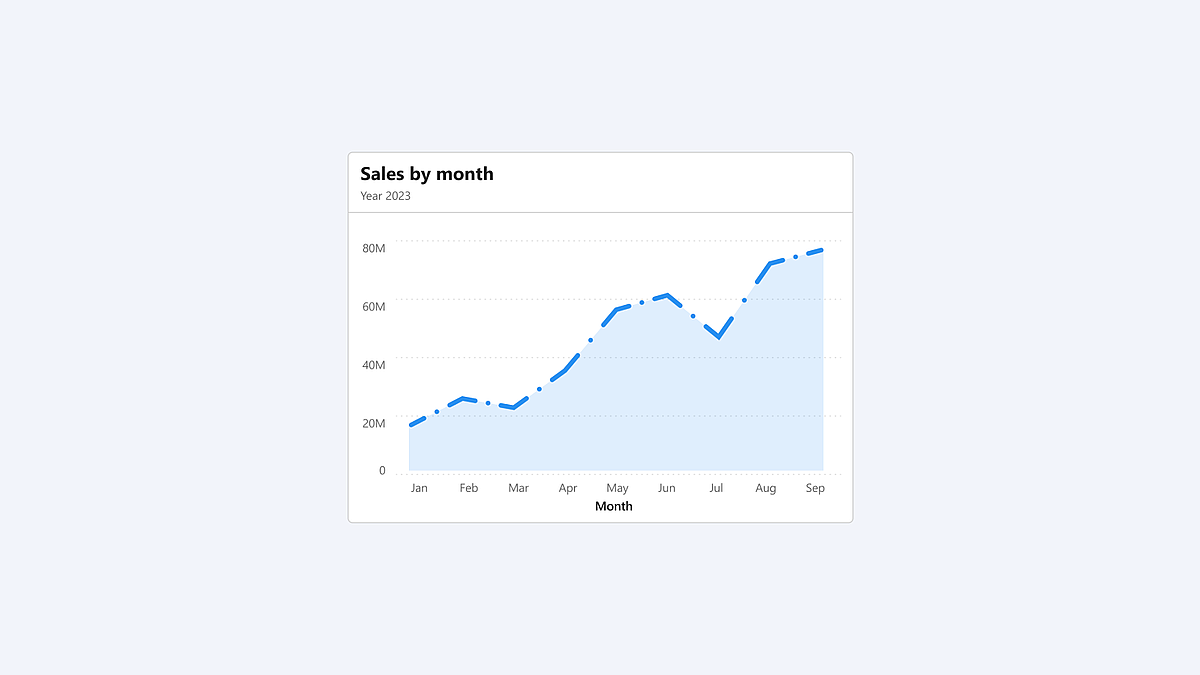
Following last month’s introduction of the initial line enhancements, May brings a groundbreaking set of line capabilities that are set to transform your Power BI experience:
- Hide/Show lines: Gain control over the visibility of your lines for a cleaner, more focused report.
- Customized line pattern: Tailor the pattern of your lines to match the style and context of your data.
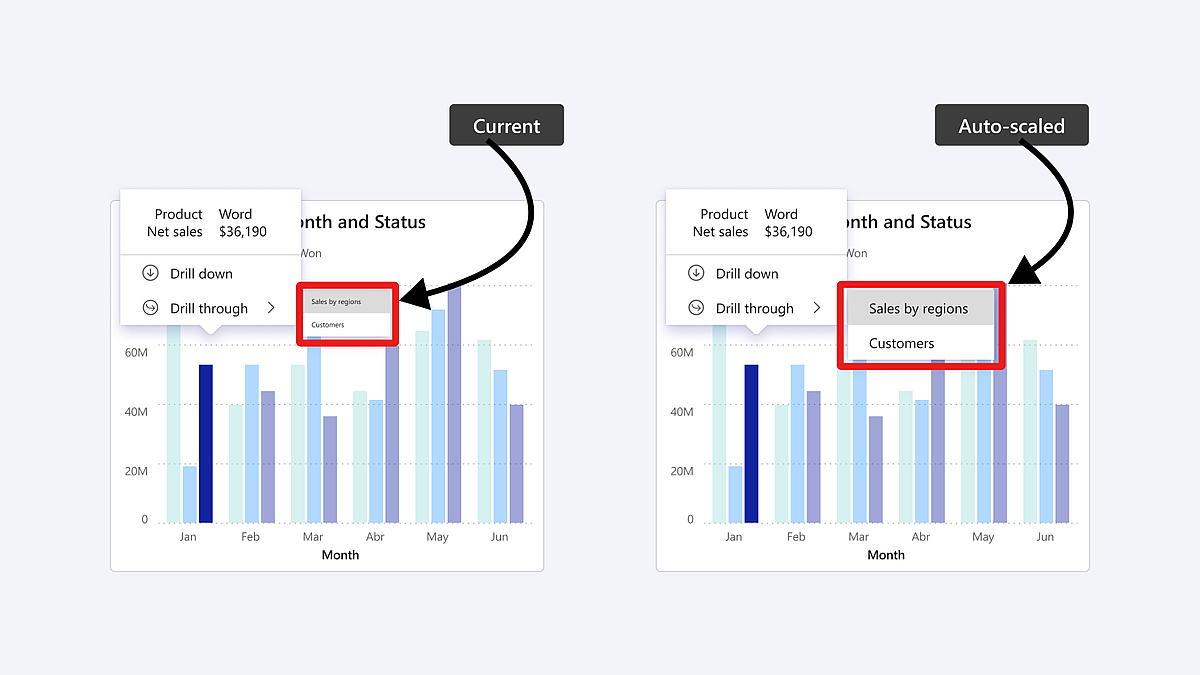
- Auto-scaled line pattern: Ensure your line patterns scale perfectly with your data, maintaining consistency and clarity.
- Line dash cap: Customize the end caps of your customized dashed lines for a polished, professional look.
- Line upgrades across other line types: Experience improvements in reference lines, forecast lines, leader lines, small multiple gridlines, and the new card’s divider line.
These enhancements are not to be missed. We recommend visiting Microsoft's dedicated blog for an in-depth exploration of all the new capabilities added to lines, keeping you informed and up to date.
On-Object Interaction Updates
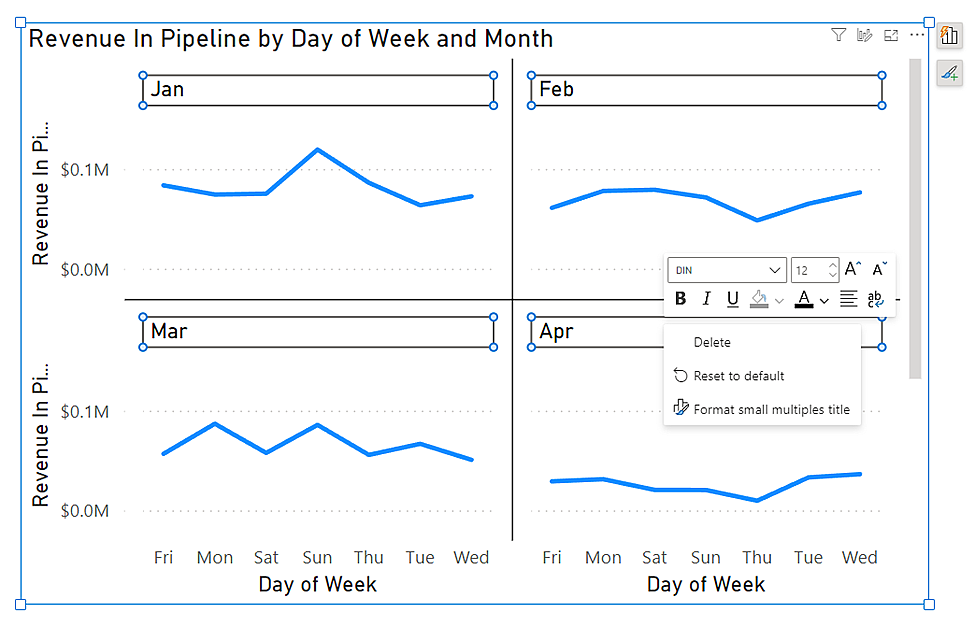
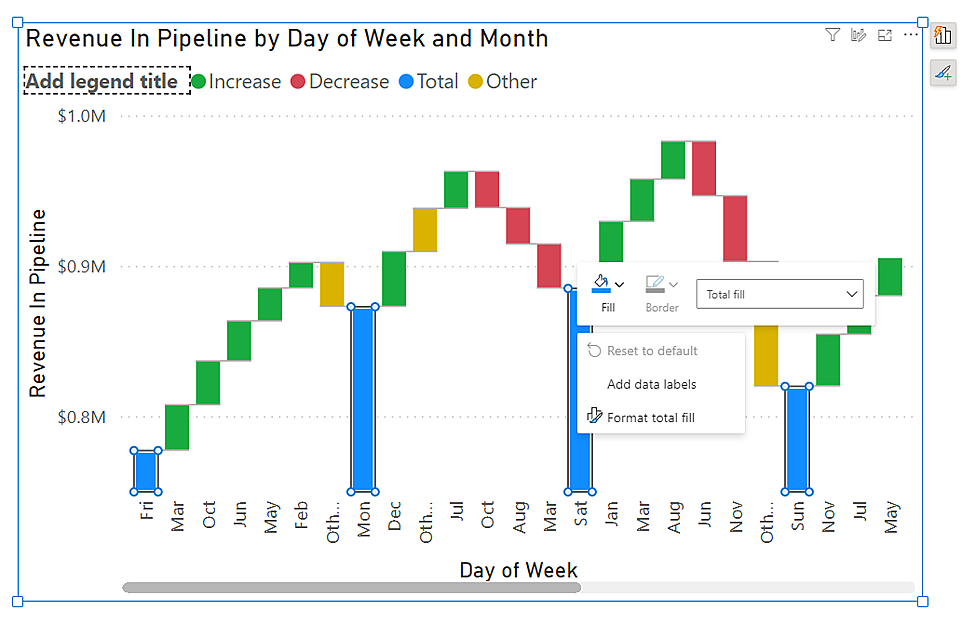
This May release, Microsoft is also excited to introduce on-object formatting support for Small multiples, Waterfall, and Matrix visuals. This new feature allows users to interact directly with these visuals for a more intuitive and efficient formatting experience. By double-clicking on any of these visuals, users can now right-click on the specific visual component they wish to format, bringing up a convenient mini-toolbar. This streamlined approach not only saves time but also enhances the user’s ability to customize and refine their reports with ease.
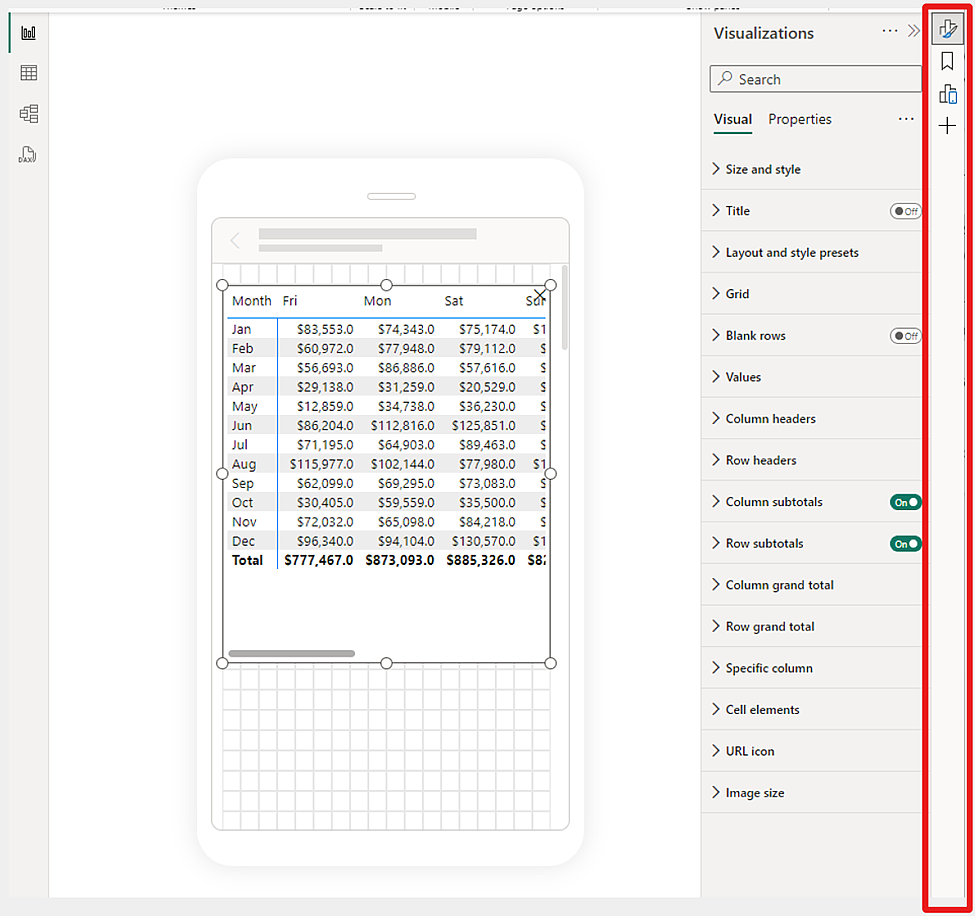
Microsoft’s also thrilled to announce a significant enhancement to the mobile reporting experience with the introduction of the pane manager for the mobile layout view. This innovative feature empowers users to effortlessly open and close panels via a dedicated menu, streamlining the design process of mobile reports.
Publish to folders (Preview)
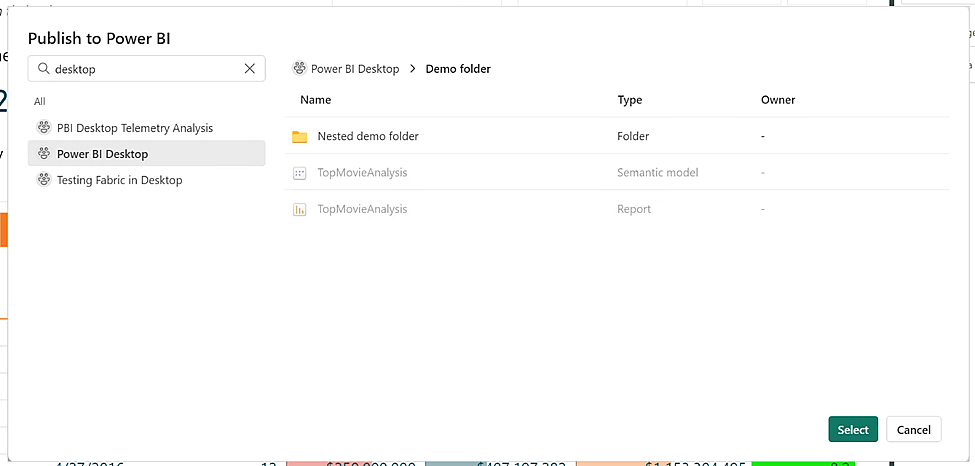
Microsoft recently announced a public preview for folders in workspaces, allowing you to create a hierarchical structure for organizing and managing your items. In the latest Desktop release, you can now publish your reports to specific folders in your workspace.
When you publish a report, you can choose the specific workspace and folder for your report. The interface is simplistic and easy to understand, making organizing your Power BI content from Desktop better than ever.
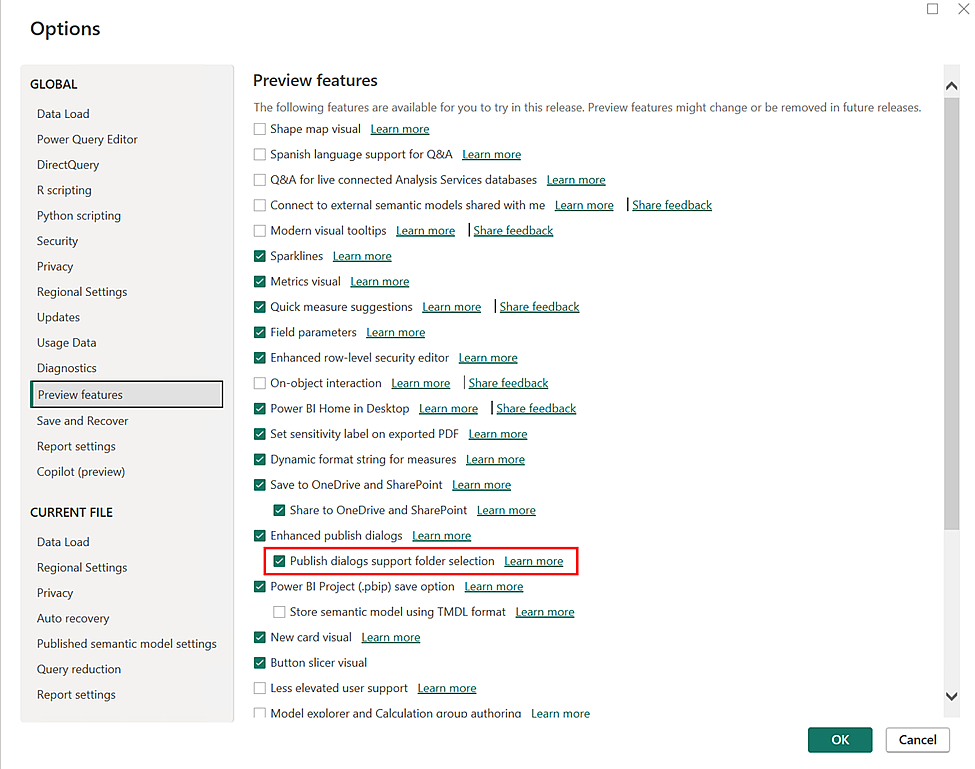
To publish reports to specific folders in the service, make sure the “Publish dialogs support folder selection” setting is enabled in the Preview features tab in the Options menu.
Learn more about folders in workspaces.
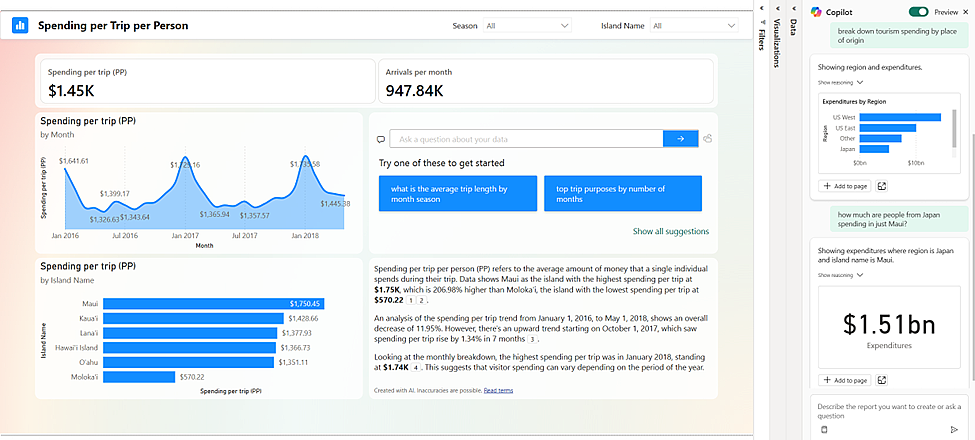
You can now ask Copilot questions about data in your model
We’re excited to preview a new capability for Power BI Copilot allowing you to ask questions about the data in your model! You could already ask questions about the data present in the visuals on your report pages – and now you can go deeper by getting answers directly from the underlying model. Just ask questions about your data, and if the answer isn’t already on your report, Copilot will then query your model for the data instead and return the answer to your question in the form of a visual!
Microsoft is starting this capability off in both Edit and View modes in Power BI Service. Because this is a preview feature, you’ll need to enable it via the preview toggle in the Copilot pane.
Modeling
Announcing general availability of model explorer and authoring calculation groups in Power BI Desktop
Micorsoft is excited to announce the general availability of Model Explorer in the Model view of Power BI, including the authoring of calculation groups. Semantic modeling is even easier with an at-a-glance tree view with item counts, search, and in context paths to edit the semantic model items with Model Explorer. Top level semantic model properties are also available as well as the option to quickly create relationships in the properties pane. Additionally, the styling for the Data pane is updated to Fluent UI also used in Office and Teams.
A popular community request from the Ideas forum, authoring calculation groups is also included in Model Explorer. Calculation groups significantly reduce the number of redundant measures by allowing you to define DAX formulas as calculation items that can be applied to existing measures. For example, define a year over year, prior month, conversion, or whatever your report needs in DAX formula once as a calculation item and reuse it with existing measures. This can reduce the number of measures you need to create and make the maintenance of the business logic simpler.
Available in both Power BI Desktop and when editing a semantic model in the workspace, take your semantic model authoring to the next level today!
Learn more about Model Explorer and authoring calculation groups with these resources:
