Increase your analytical skills and make data analysis easier and more enjoyable.

BI Academy I
Gain new self-service data analysis skills and create visually sophisticated dashboards with Power BI platform.

Excel and Power BI Online Workshop
At BI Academy I you learn how to use Microsoft Excel pivot tables and Power pivot as well as Power BI to automate reporting, improve report design and prepare calculations for KPIs that will help you make better decisions, faster.
With better data analytics you can address common reporting challenges such as:
- Time-consuming report preparation
- Missing or out-of-date data
- Inefficient report sharing process
- Data fragmentation
- Large number of reports which sometimes provide conflicting information
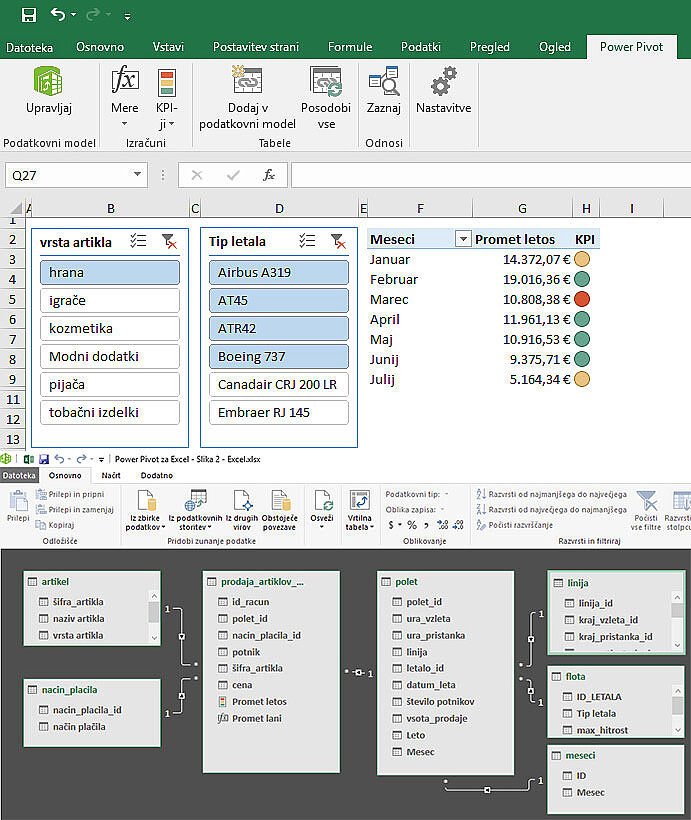
Excel Power Pivot
- Have an unimpeded access to data (without having to worry about data corruption, since you can not change or damage source data)
- Work with fresh data from various tables
- Gain a very good understanding of your data and table relations
- Create completely customized reports with pivot tables and pivot charts
- Prepare simple key performance indicators
- Additional report customization
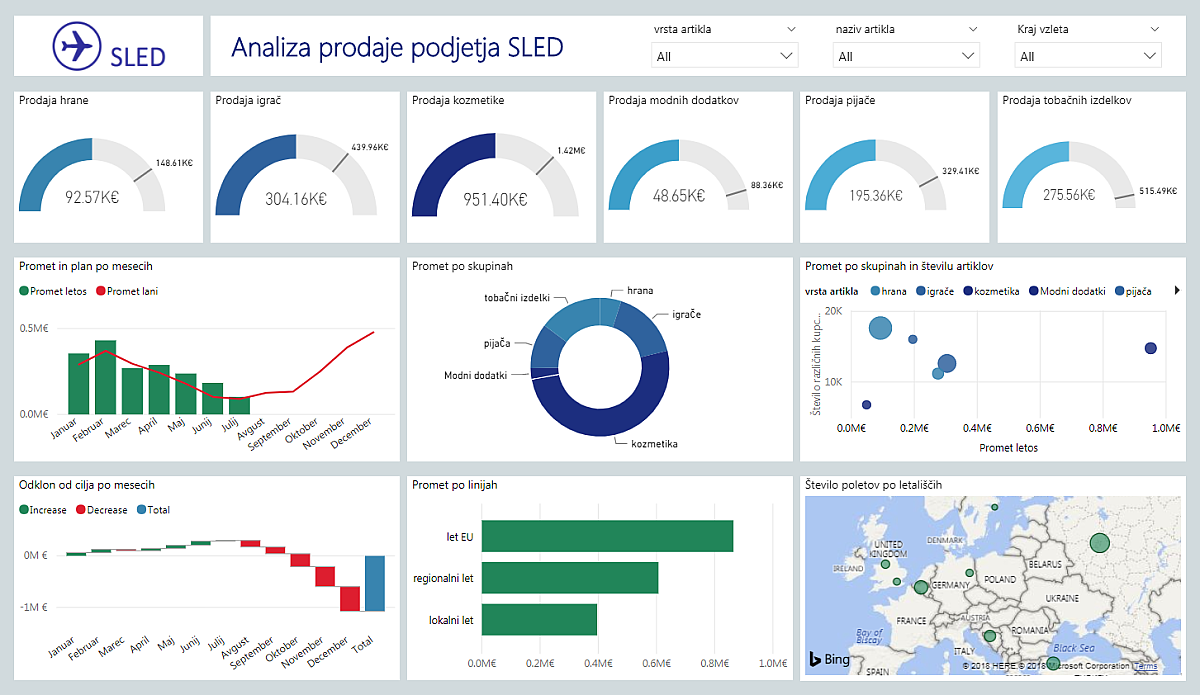
Power BI Dashboard
- Learn about Power BI platform
- Import data, create data model (table relations)
- Prepare calculated columns and advanced visualizations
- Publish reports to Power BI portal
- Understand how to chose from various types of charts
- Use story telling principles to enable reader to quickly discern useful information

Customer Testimonial
Upgrade from Excel to Power BI
When the need to improve our Excel skills arose in our company, we selected B2 BI from a long list of providers to help us with that. We quickly recognized B2 BI as an efficient and friendly partner to help us on our jouney to improve our analytical skills. We were very pleasantly surprised by their flexibility and being able to adapt to the needs of every participant, no matter their skill level.
Since we value quality execution as well as professional and kind approach, we will definitely collaborate with B2 BI again.
Who is it for?
For anyone that prepares or uses advanced anaytics in Excel, be it in finance, controlling, marketing, sales or other departments.
Pre-requisites
Microsoft Excel knowledge, in particular Pivot tables.
Duration
Duration of the workshop can be adjusted to your needs, but is typically 14 instructional hours long and executed in two sessions.
BI Academy I Agenda
- In the First workshop: Excel – Power Pivot you prepare analysis of business data, simulating actual working environment, so that you can then transfer new acquired skills back to your workplace. You learn how to connect to databases, understand their value, prepare advanced analysis with automatic refresh and create new lookup tables to improve report readability.
- In the second workshop: Power BI – Dashboard you learn the process of preparing reports in Power BI and how it enables better and faster decision-making. You improve your analysis with visually perfected graphs and enable easier report sharing; show key performance indicators on one page, upgrade existing analysis and share the reports.
- At the end of the workhop you tackle an individual practical assignment. You prepare custom sales report to put your new acquired skills into practice.
Workshop Price
Cena
590,00 €
Trusted by


